


Part 1 of 3 — Sick Leave and Job Satisfaction: What Absence Data Is Really Telling You
Part 2 of 3 — How Occupational Health Care Services Monitor Sick Leave in Finland
Part 3 of 3 — How to Design an Absence Monitoring System That Actually Tells You Something (this article)
In Part 1 of this series we looked at what sick leave patterns reveal about job satisfaction and workplace health. In Part 2 we explored how occupational health care providers in Finland actively monitor those patterns and intervene early when something needs attention. In this final post, we get practical: how should an organization design its own absence monitoring system to reliably catch real signals and avoid the traps that make most systems either useless or counterproductive?
The Core Design Challenge
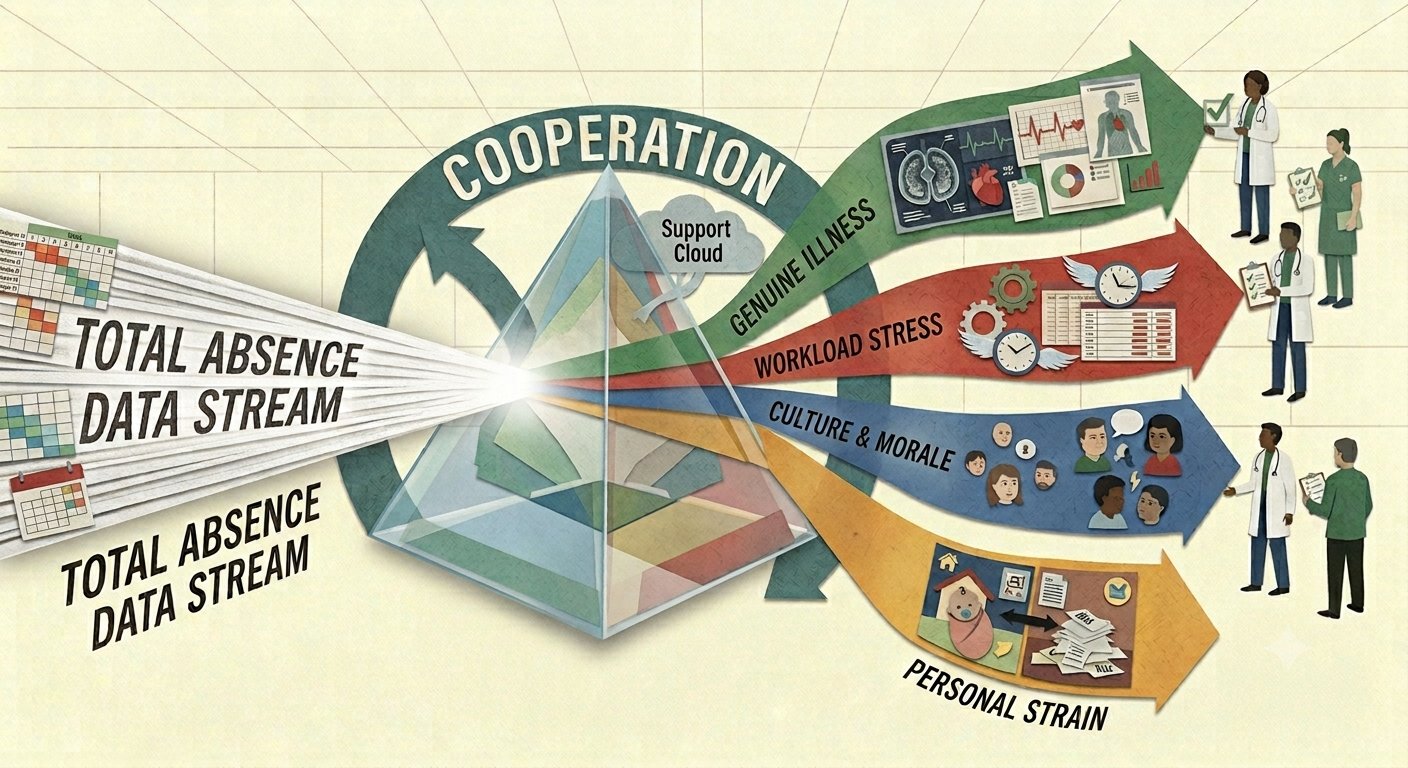
A single absence record carries almost no information on its own. The system has to be built around aggregation, comparison, and pattern recognition rather than individual events. The goal isn’t to minimize the absence number – that framing leads directly to the wrong outcomes. The goal is to identify where to look more closely: which teams, roles, or conditions might need attention, and what kind of attention they need.
A few design principles consistently separate systems that surface useful signals from ones that generate noise.
Separate Absence by Type, Not Just Total Days
Short, frequent absences behave differently from long-term sickness absence, and they usually have different causes. Frequent short absences are more associated with low-grade stress, withdrawal behavior, or the kind of early-warning patterns discussed in Part 2. Long-term absence is more often tied to serious illness, injury, or burnout requiring occupational health involvement and a structured return-to-work plan. A monitoring system that lumps these together will average out the signal in both directions.
Tools like the Bradford Factor weight frequency of separate absence episodes more heavily than total days, on the logic that ten single-day absences are more disruptive and more diagnostic than one ten-day absence for a scheduled medical procedure. The formula itself is debated, but the underlying principle is sound: frequency and duration are different signals and should be tracked separately.
Analyze at the Team Level, Not the Individual Level
Individual absence data is mostly noise, and flagging individuals based on it raises real privacy and discrimination concerns – particularly under the EU’s GDPR, which treats health data as a special category requiring stronger legal grounds and stricter safeguards. Individual medical reasons should stay confidential to occupational health functions, with only aggregate, anonymized rates flowing to management for pattern analysis.
The more statistically meaningful and more defensible approach is to monitor absence rates at the level of teams, shifts, departments, or manager spans of control, and compare those rates against similar units rather than against a single organization-wide average. If two otherwise comparable shifts doing identical work under different supervisors show persistently different absence rates, something about the work environment is the more likely explanation than random health variation. This is essentially statistical process control applied to HR data: establish a baseline and its normal variation for a given unit, then flag genuine deviations, typically anything drifting beyond two standard deviations from a rolling average, rather than reacting to every fluctuation.
Track Trends Over Time, Not Snapshots
Point-in-time absence rates are heavily influenced by season, so rolling averages and year-over-year comparisons at the same time of year matter far more than any single month’s figure. A flu season bump that hits all teams equally is noise. One team’s rate climbing while comparable teams stay flat is a signal.
Trend direction often matters more than absolute level. A team with historically high but stable absence may simply reflect an older workforce or a physically demanding role. A team whose rate is climbing steadily, even from a low base, often indicates something is changing in the work environment – a new manager, a reorganization, increased workload, or deteriorating team dynamics.
Specific within-week patterns are also worth building into the system. Absence clustering on Mondays or Fridays, spikes following specific organizational events like a round of redundancies or a period of mandatory overtime, or patterns that consistently follow a particular shift are all informative shapes that aggregate monthly figures will smooth over.
Triangulate with Other Data Sources
Absence data becomes far more interpretable alongside other signals rather than in isolation. The most useful companion data sources tend to include:
- Engagement or psychosocial risk survey results, if a department has both elevated absence and poor survey scores on workload, autonomy, or management support, that convergence is a much stronger basis for action than either signal alone.
- Turnover and exit interview themes for the same unit.
- Overtime and workload records – absence often rises in the weeks following sustained overtime.
- Incident and near-miss reports – physical hazard exposures and absence patterns sometimes point at the same underlying problem.
- Occupational health referral data, where confidentiality allows aggregate sharing.
When several independent signals point at the same team or function, the case for investigation becomes far stronger than any single metric could justify.
Build the Response Pathway in Advance
A monitoring system without a defined response pathway tends to either sit unused or get applied inconsistently. It’s worth deciding in advance what happens at each trigger point, so the response is proportionate and purposeful rather than reactive:
- A team flagged for elevated short, frequent absence might prompt a structured manager conversation focused on workload, team climate, and job design, not individual performance management.
- A team flagged for rising long-term absence might trigger an occupational health review of working conditions and ergonomics.
- An individual on long-term absence (whatever the cause) should move into a structured, supportive return-to-work process, managed separately from the statistical monitoring used for team-level patterns.
In Finland, this response pathway is partly built into the statutory system: employers are required to work with occupational health services on monitoring work ability, and there are defined thresholds, for example, after 90 days of sick leave within a year, that trigger mandatory occupational health assessments. Knowing these thresholds and building them into internal processes is also a part of legal compliance.
Get the Framing Right
The single biggest design risk is that a monitoring system framed around minimizing absence numbers will simply push the problem into presenteeism: people stop taking needed leave to avoid being flagged, the numbers improve on paper, and the underlying health and workplace issues go undetected.
A system framed instead around identifying where to invest, in staffing, job design, ergonomics, management support, or early health intervention, produces very different organizational behavior. It also produces more honest data, because people aren’t being incentivized to hide what the data is trying to surface.
The Bottom Line
Sick leave data is most valuable not as a number to be minimized, but as one input, among several, for identifying where psychosocial or physical risks are concentrated, so they can be addressed at the source. A well-designed monitoring system, working alongside occupational health care services and informed by the psychosocial risk frameworks covered in Parts 1 and 2 of this series, can do exactly that. The difference between a system that works and one that doesn’t shows up not in the sophistication of the dashboard, but in whether the organization ever finds out what the data was trying to tell it.
This was the final post in our three-part series on sick leave, job satisfaction, and occupational health monitoring. If you work in Finland or are planning to, understanding how these systems operate is a practical part of workplace safety knowledge — and something we cover in depth in our online occupational safety training programmes.